
1. Start first with the liquidity dashboard, accessible via the navigation menu Analysis > Liquidity reports. This gives you a 360-degree liquidity view of your company. You'll find sections for cash flow statement, operation analysis, team/project analysis, financing and investing analysis, runway analysis, and capital efficiency.
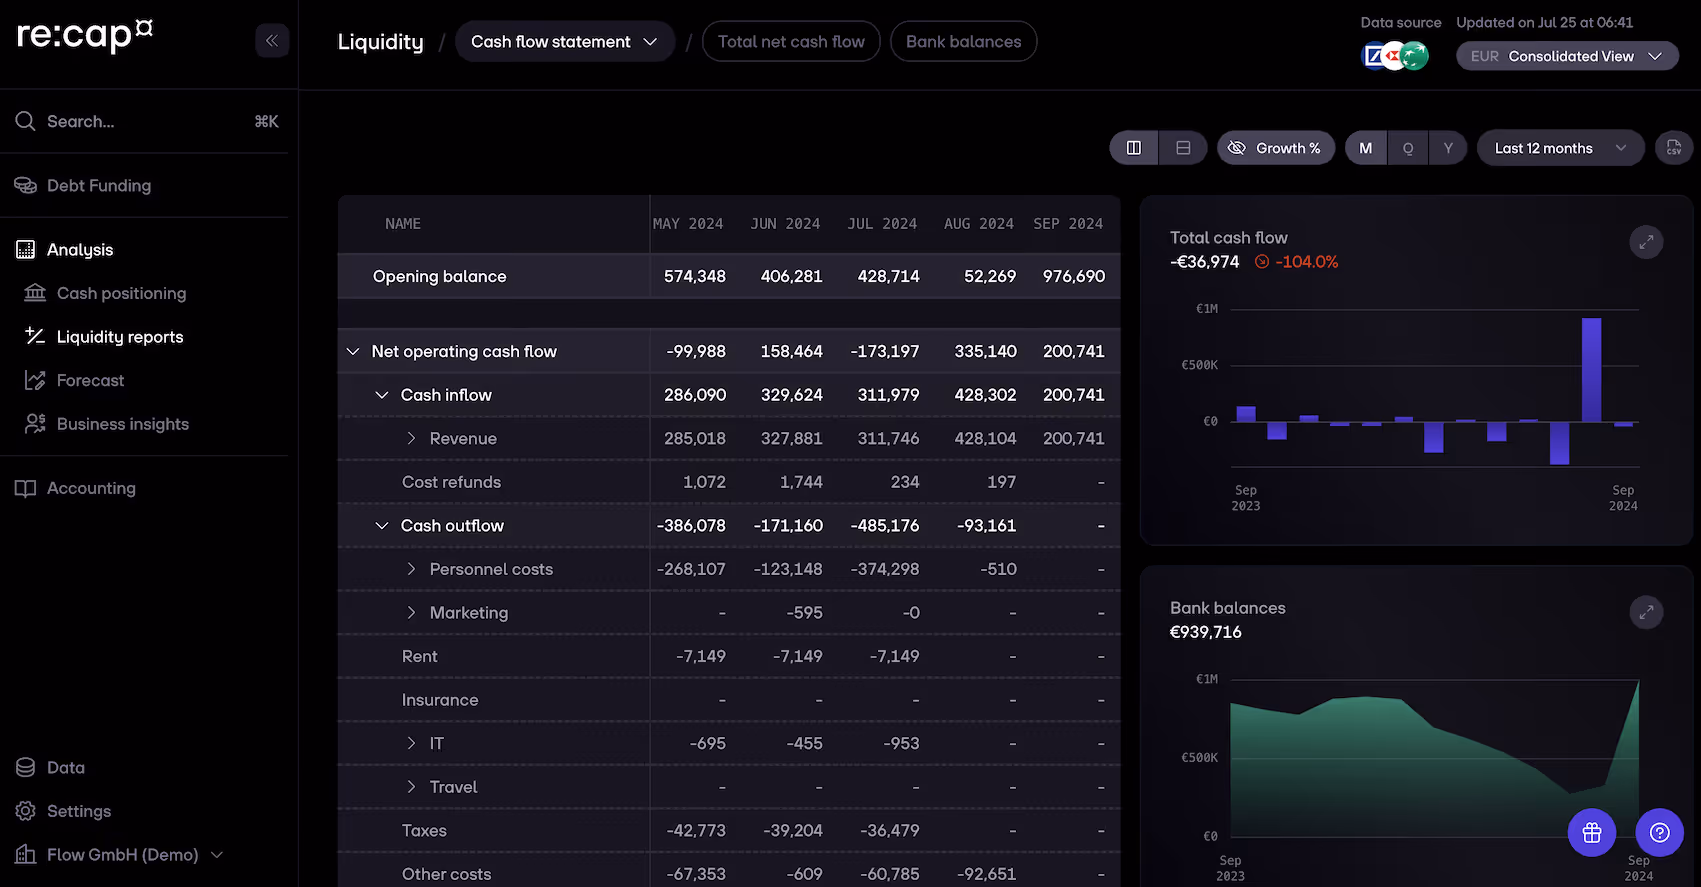
2. You can drill down every section by clicking on the tab at the top. For example, the Cash flow statement can be drilled down to Total net cash flow or Bank balances.


