
Now live: Capital AI, your financial sparring partner


Better understand your financial performance in real-time and get guidance to keep your business moving in the right direction. Identify your capital needs to unlock the next stage of growth.
.avif)


“re:cap gives me a daily overview of available liquidity and its alignment with cash flow. Finally, a seamless comparison of my planned data with reality.”


"We use re:cap for two purposes: 1) as a financing source and an alternative to equity in the context of working capital management and bridging the gap to break-even; 2) to create transparency over cash flows and plan liquidity."
“With re:cap, we can expand our financing options and have a transparent overview of our cash flows. The platform helps us make data-driven financial decisions and forecast future liquidity developments better.”
"We are completely satisfied with re:cap. The platform is modern and intuitive and fits perfectly into our funding process. We particularly appreciate the high transparency in relevant KPIs and the flexibility it offers. Additionally, the excellent support makes the entire process smooth and efficient."
"The software platform is seamlessly integrated into the funding process and provides insights into P&L and cash flow. What I particularly like is the benchmarking feature, which gives a sense of the current situation compared to similar SaaS companies."

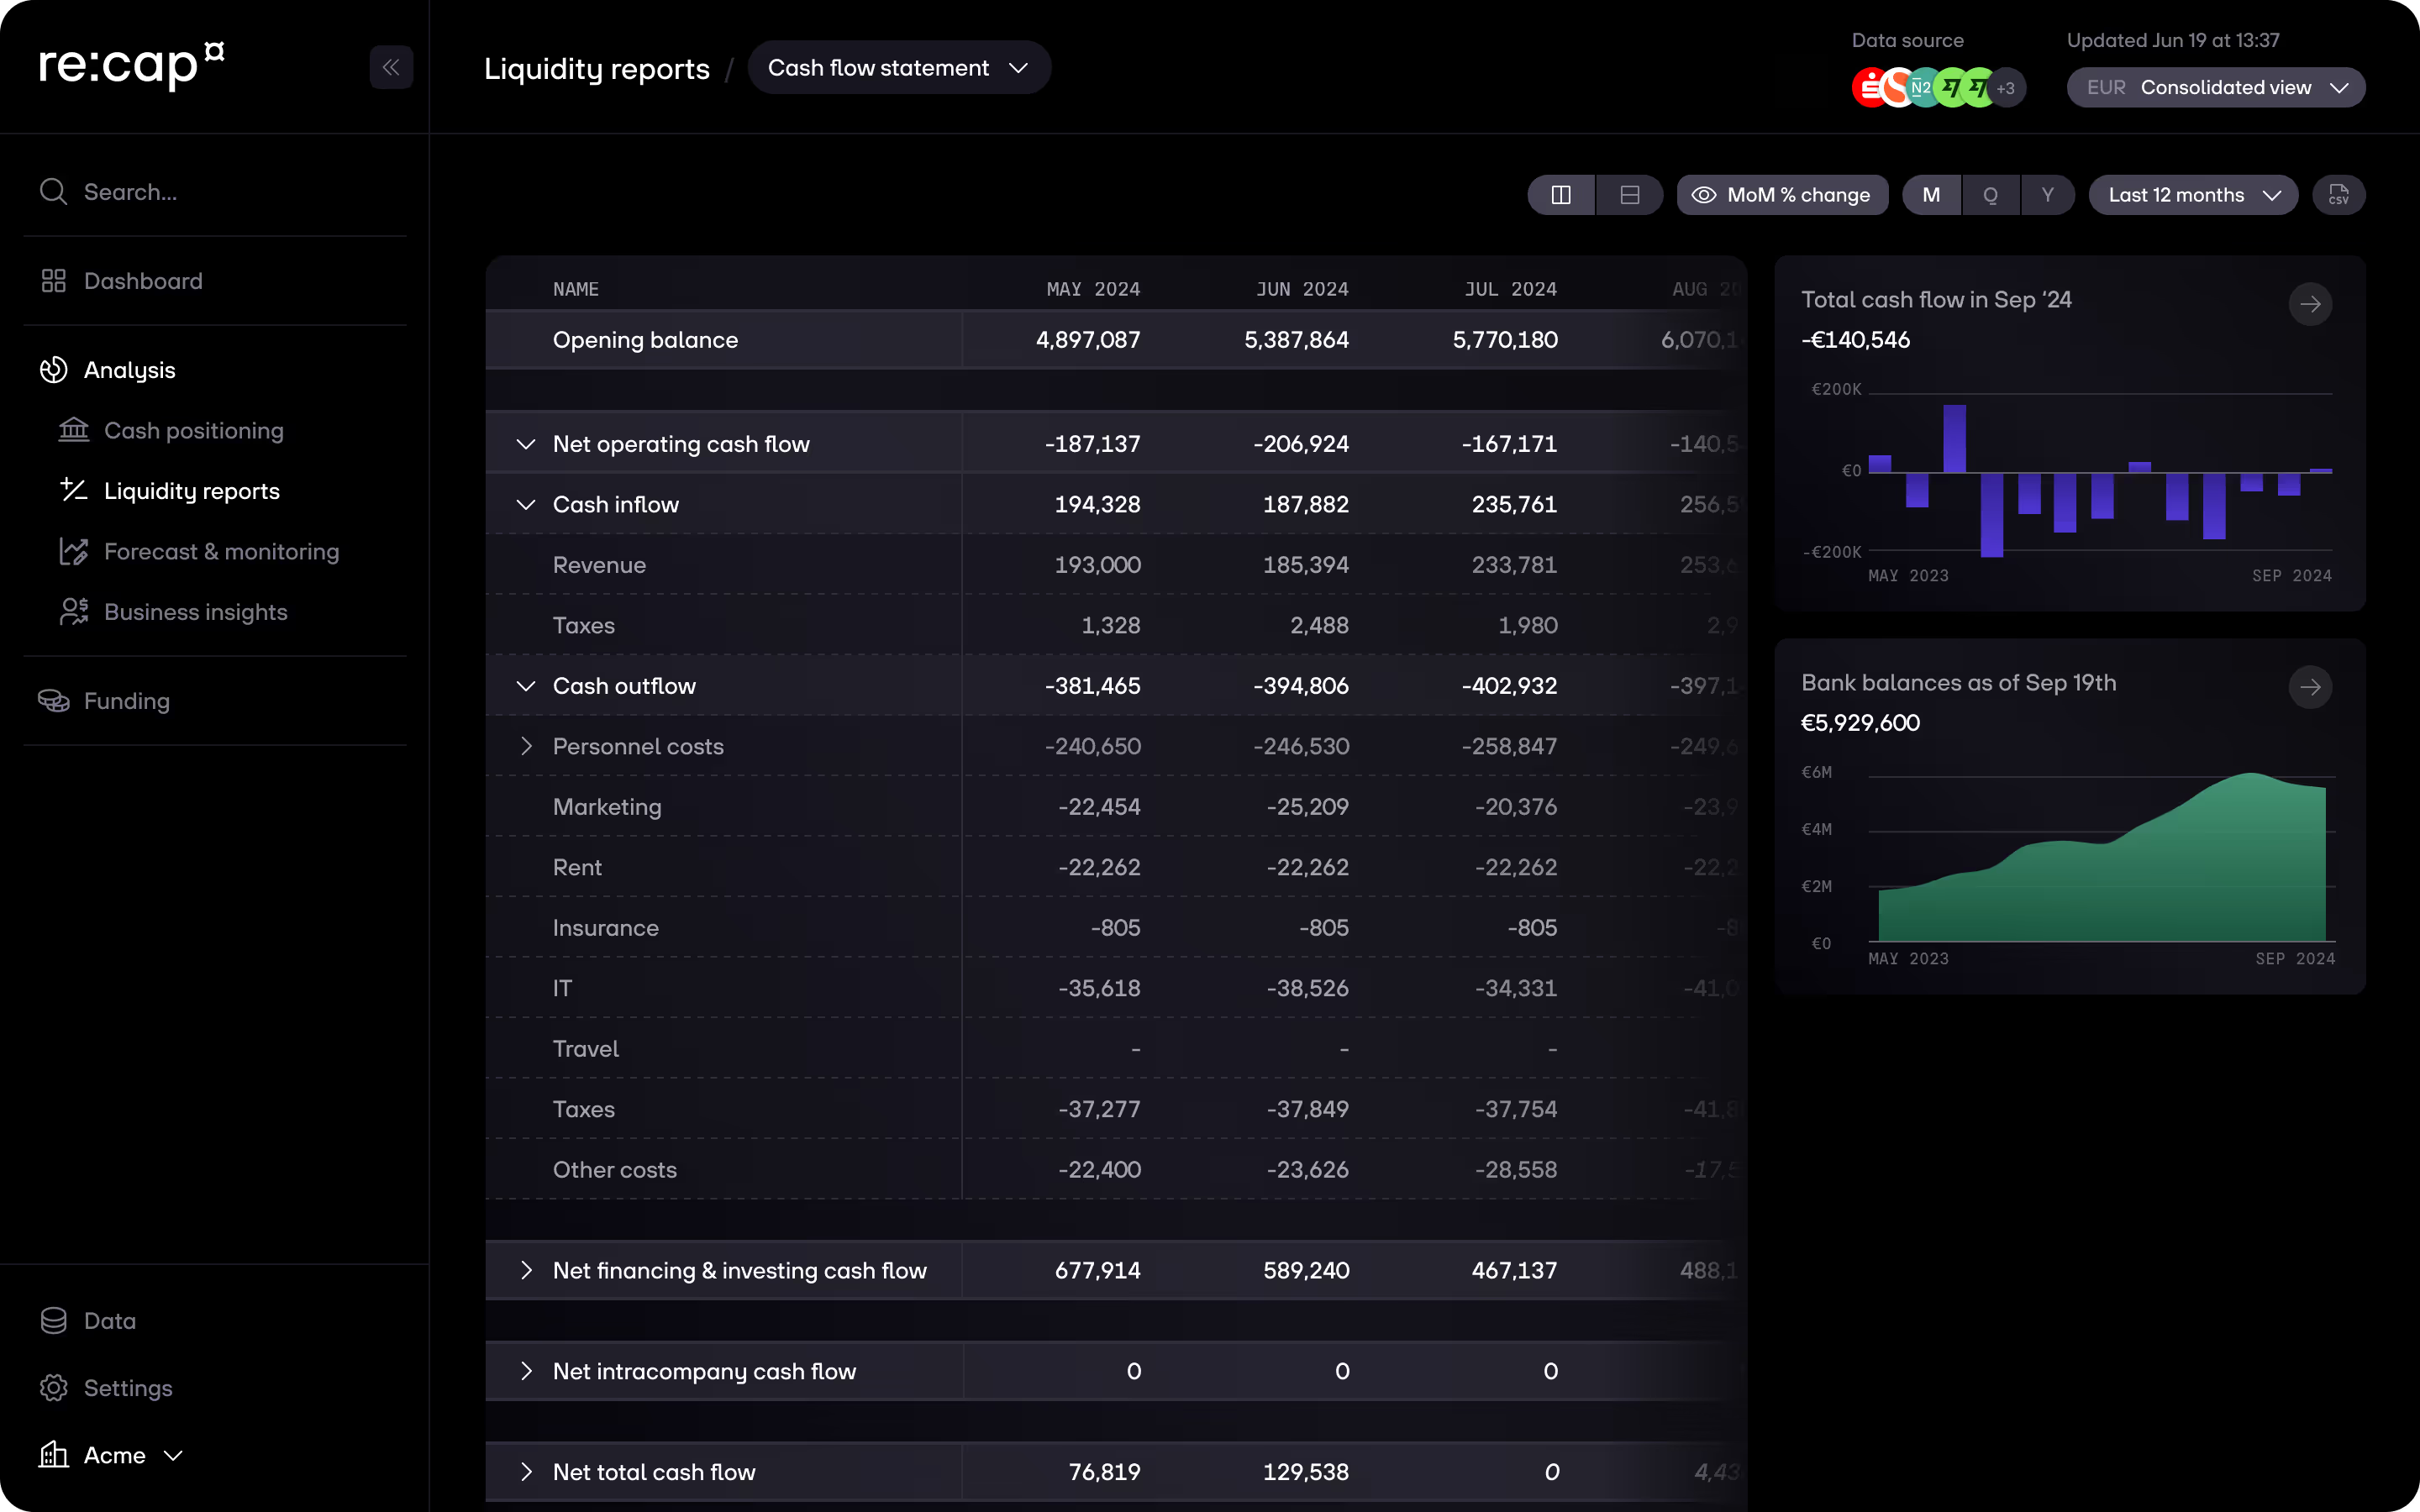
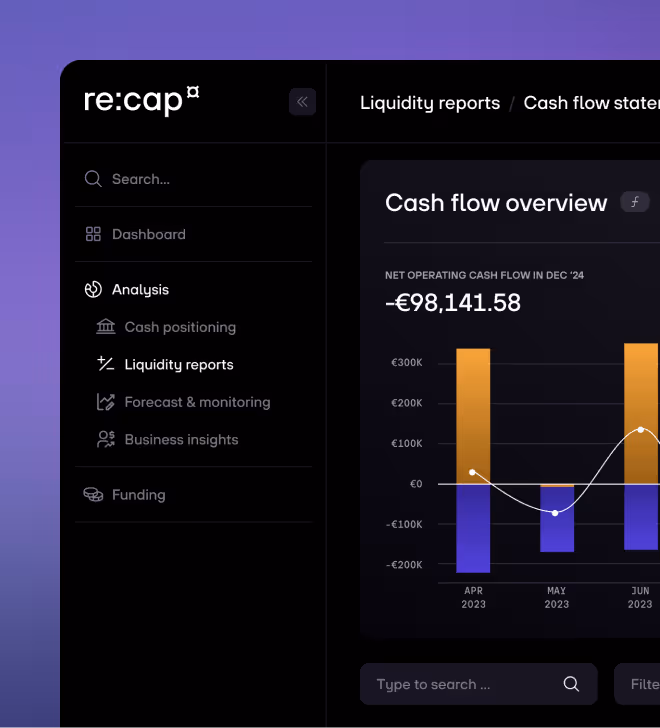
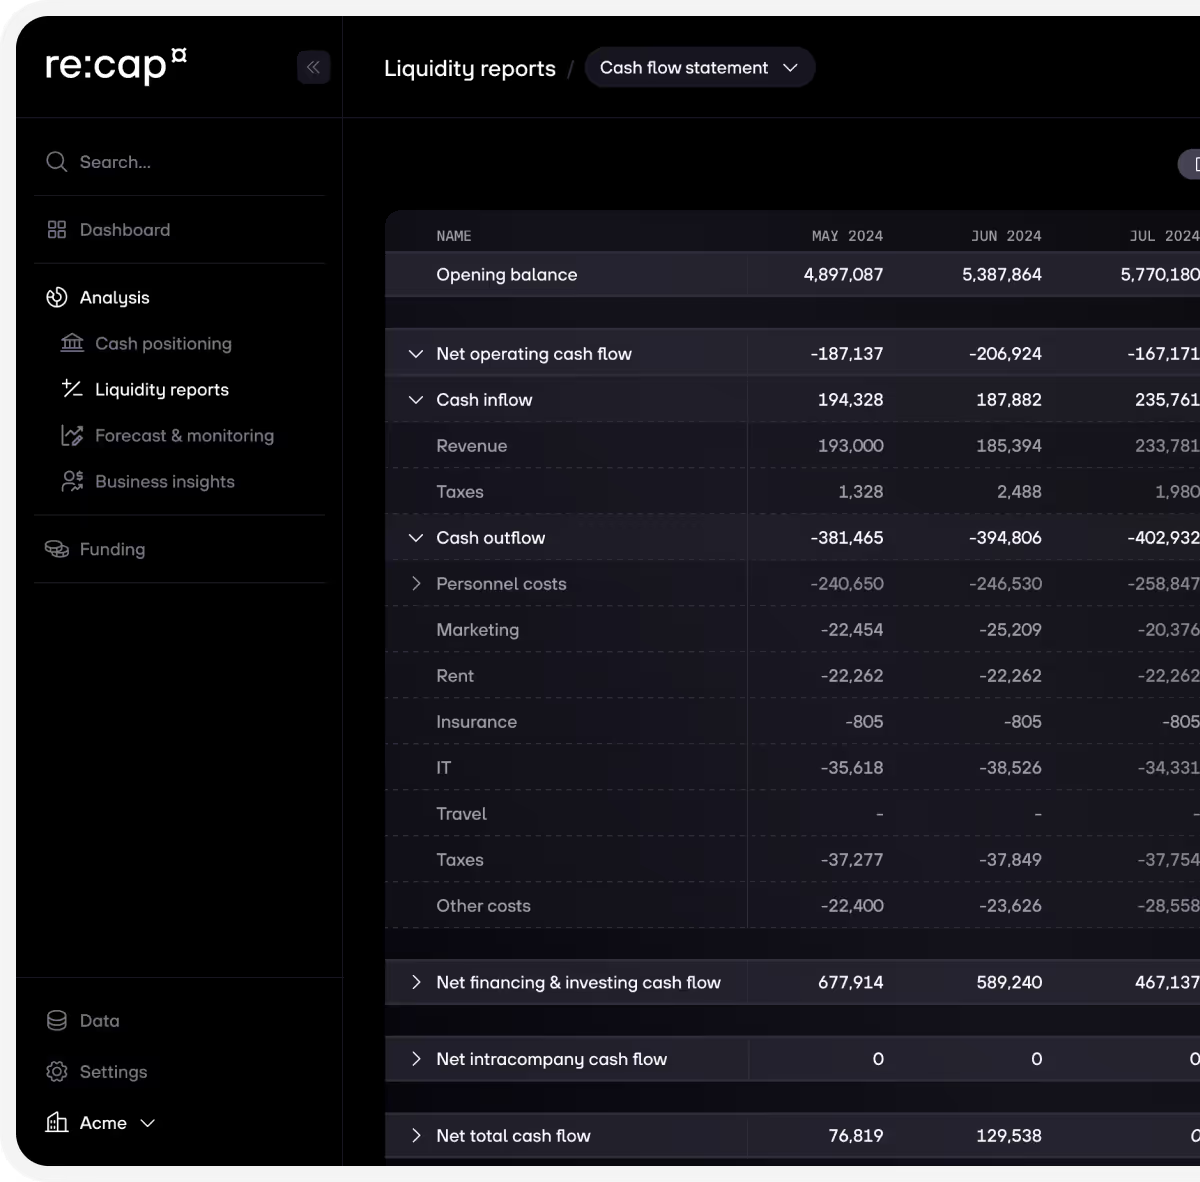
Analysis is your executive summary for capital decisions. When you know where you stand and how your financials are evolving, you can decide whether to fund your next steps internally or raise capital.
Get a high-level view of your company’s financial performance in one intuitive dashboard. Cut through the clutter and get to the insights that matter most, fast.


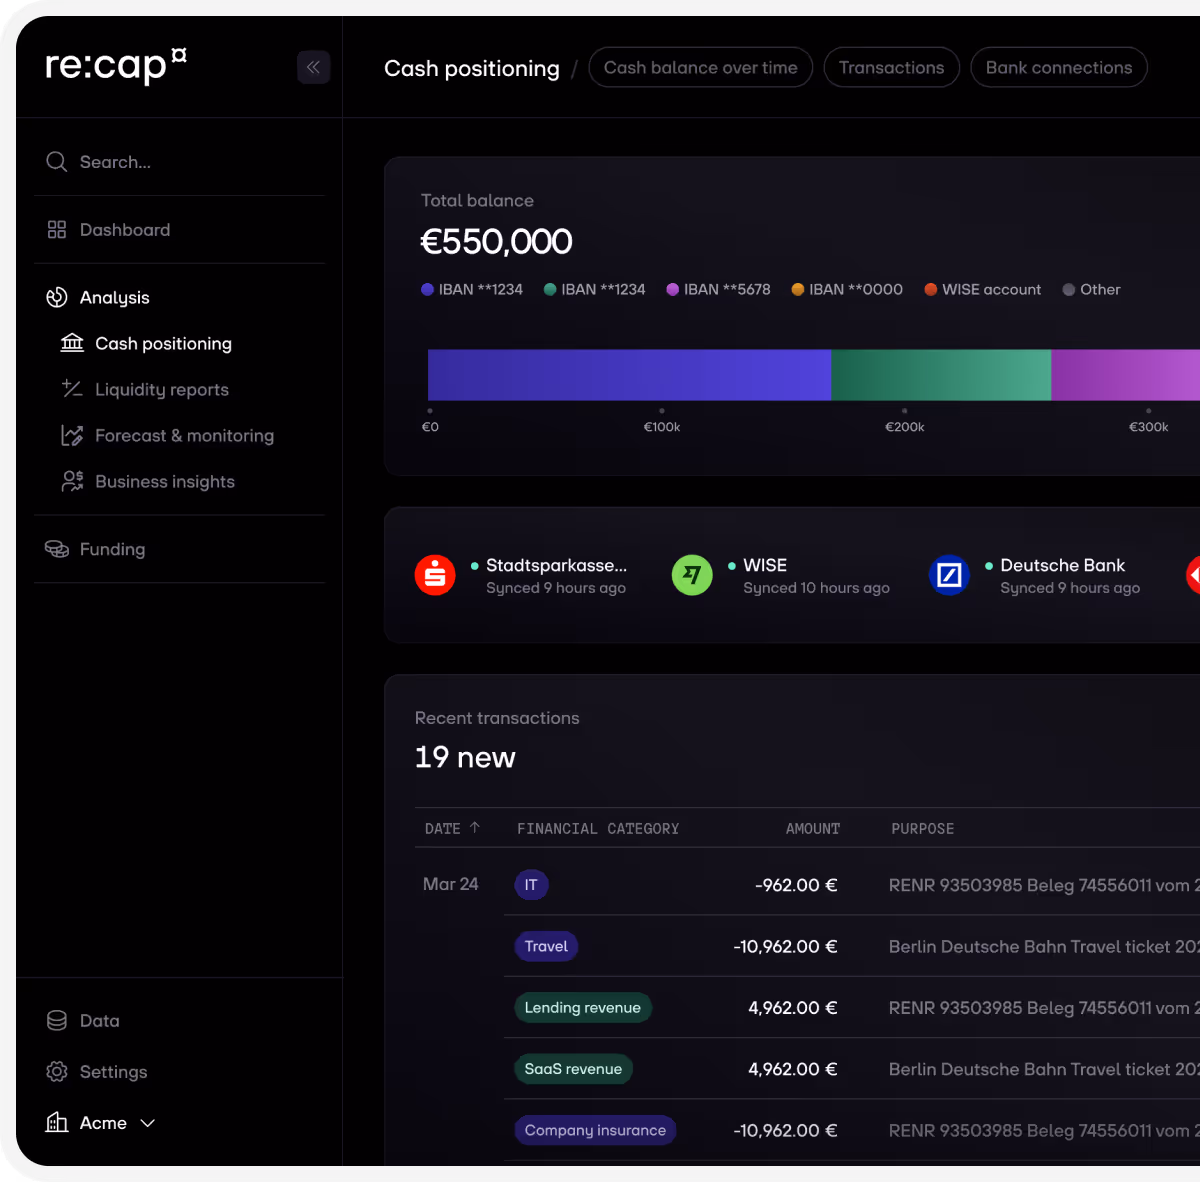
Track your total balance, transactions, and liquidity trends across all accounts, automatically categorized and easy to digest.
Drill into cash flow, team performance, and operational efficiency to understand where your money goes and how well it works for you.
Use the full scope of your real-time data. Securely connect your data sources with re:cap, no technical expertise needed.


We help you answer the simple yet essential question: Is my business on track?
Manage and optimize liquidity, reports, forecasts with all your bank, revenue, customer, and accounting data. Ready to use in minutes.


It demands more than just spreadsheets. You need a real-time overview of your bank accounts, balances, and transactions in one place. You need to analyze your revenue and customer data to make smarter decisions. You need to plan your liquidity based on historical data, forecast future scenarios, and track your financial health. That's what re:cap Insights offers you.
Access key metrics, bank accounts, and balances in a single, easy-to-read dashboard. Track cash inflows and outflows and make liquidity pulse checks part of your management routines.


No more multiple bank logins, manual file uploads, or messy spreadsheets. See all your accounts, balances, and transactions in one dashboard. Plan ahead with liquidity forecasts and track key business metrics – all in one platform.


